Population is one of the most important biological organizations that we study in ecology. It is important for us to understand the meaning of population, population size, population density, and population growth patterns in order to understand how the trend is going to affect our natural resources, biodiversity, and climate as a whole. This article is dedicated to studying each and every aspect of population in detail.
What is Population?
The simple definition of population is – ‘’It is a group of organisms living in a well-defined geographical area, sharing common resources and interbreeding among themselves.’’ Let’s understand this definition with a simple diagram:

In this diagram above, organisms are living in a well-defined geographical area. These organisms are capable of interbreeding and forming new offspring within the well-defined area. So, the number of organisms living within this area forms a population. Every population has distinct characteristics that we’re going to discuss in the next heading below.
Different Characteristics of a Population
- Population size
- Population density
- Population growth
Population size: It is defined as the number of individuals present within a population. For example, say, the population size of Delhi is 10 million, it means, the total number of individuals in Delhi is 10 million.
Population density: It is defined as how many individuals are living in a particular area. In other words, how many individuals are present in, say, 1 km, or 1 mile, etc. For example, as we mentioned above that the population of Delhi is 10 million, it represents the population size of Delhi, but it does not give any information about how many people are living in South Delhi or East Delhi. So, when we consider population per unit area, it gives us the information of the population density.
Population growth: it is defined as how the size of a population changes over time. We should know that population is dynamic in nature. Now the question arises — what is the significance of studying population growth? Well, studying population expansion provides information about how and why the size of a population is increasing / decreasing or remaining stable. By knowing population increase, we can also learn the effect of population growth on natural resources, biodiversity and climate change and their effects on organisms. For instance, if the population is increasing, it means, the natural resources would be utilized exhaustively. This will result in competition among individuals or species for resources. Competition would lead to the death of inferior species and only superior species would survive. In other words, biodiversity would decrease. With increase in human population, more deforestation would occur and that would lead to climate change such as global warming. With these changes, organisms would suffer eventually.
Terms Used to Understand Population Growth:
There are a few terms that we need to understand the concept of population growth:
- Birth rate / Death rate (B, D)
- Population growth rate (dN/dt)
- Per capita population growth rate (r)
We can understand the above terms by citing a simple example of the population of rabbits. Let’s say, the total population (N) of rabbits in 2019 was 600 rabbits. The birth rate (B) of rabbit was 60 rabbits per year and the death rate (D) of rabbit was 30 rabbits per year. Now, we have total population (N) of rabbit = 600 rabbits; birth rate (B) = 60 rabbits /year; death rate (D) of rabbit = 30 rabbits / year. Based on this information, we can calculate the population growth rate.
Population growth rate (dN/dt) of 2019 = (B — D) = (60 rabbits / year – 30 rabbits / year) = 30 rabbits / year
So, dN/dt = 30 rabbits / year
If you look at this population growth rate, it gives information about the growth rate of 2019 i.e., 30 rabbits per year. However, this contribution of 30 rabbits is from all 600 rabbits in a population. What if we want to calculate the population growth rate per individual meaning what is the contribution of each individual out of 600 rabbits in adding 30 rabbits per year. This brings to the concept of per capita population growth rate. Per capita means per individual – how much each individual contributed in the population growth rate of 30 rabbits / year as discussed in the above example.
Per capita population growth rate (r) = population growth rate / total population size
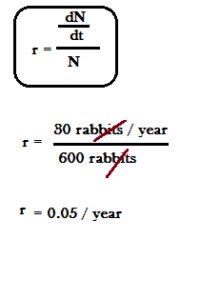
It means, the contribution of each individual in a population of 600 is 0.05 per year to increase the overall population to 630. Now, we can derive a new formula of population growth rate from the per capita population growth rate. It is demonstrated as below:
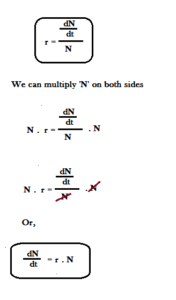
Using the above formula, we can calculate the population growth rate
dN / dt = r . N
dN/dt = 0.05 x 600
dN/ dt = 30 rabbits
So, for population growth rate, we now have two formulae:
- dN / dt = r. N
- dN / dt = (B — D)
Population growth rate at time t:
The exponential population growth graph is possible only when there are unlimited resources meaning no competition among individuals in a population or a group of population. Besides, the population growth rate formula gives the population growth rate value for a particular year. What if we want to calculate population growth with respect to time – for example, say, the population growth rate of rabbit in 2019 was 30 rabbits up to December, and we want to calculate the growth rate in January 2020 or March 2020? Well, in such a situation, we need to calculate population growth rate at time t. A complete derivation has been shown below:
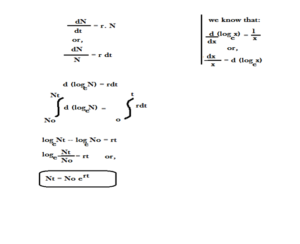
Using the above formula we can draw a population growth curve as shown below. And the formula:
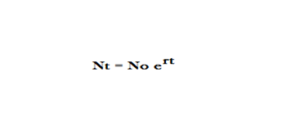
is an exponential growth equation.
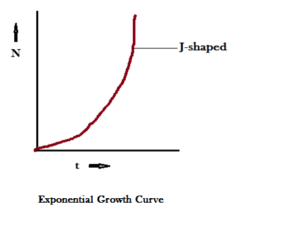
The exponential growth equation is used to calculate population at time t only if we know the value of N0, and r. The value of r (per capita population growth rate or intrinsic rate of natural increase) in 1981 was 0.0205 and in 2001, the value of r was 0.0176. Seeing the value of r in 1981 and 2001, we can easily predict that the r value has decreased with time. In other words, the per capita growth rate has decreased. We can say that the contribution per individual to the total population of India has decreased in 2001 as against 1981.
Logistic Growth Rate:
We know that the resources are not unlimited rather limited. There is a limit of any geographical area to sustain organisms. Such a limit is called the carrying capacity, represented by K. So, if we consider the carrying capacity, the population growth rate equation would change from:
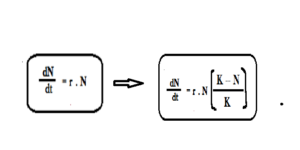
In the above equation (K — N) says how many more individuals can be accommodated to the population before it hits the carrying capacity. And (K-N)/K represents the fraction of the carrying capacity that has not yet been used up.
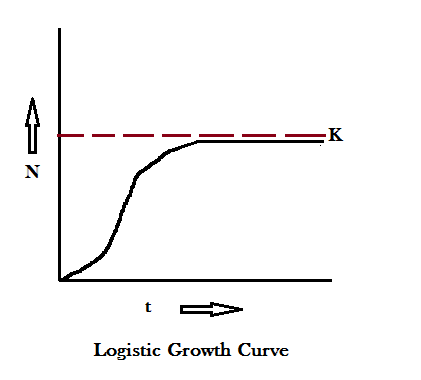
A plot of N against time t results in a sigmoid curve. This type of population growth is called Verhulst – Pearl Logistic Growth.
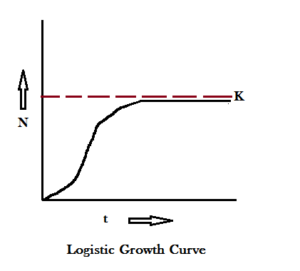
In the above graph, the first starting curve represents the lag phase meaning the growth is less; the second phase is called acceleration phase meaning the growth rate is maximum; the third phase is called deacceleration phase where the growth rate reduced and finally the fourth phase represents equilibrium or asympethode phase where growth rate reaches to constant. Logistic growth model is considered more realistic one compared to the exponential growth model.

