
Population is one of the most important levels of biological organisation that we study in ecology. To understand how a population will affect our natural resources, biodiversity and climate, we need to know its size, its density and, above all, its population growth curve. This article covers each of these, using the same equations and examples as NCERT Class 12 Biology (Organisms and Populations).
What is a population?
The simple definition: a population is a group of individuals of the same species living in a well-defined geographical area, sharing or competing for similar resources and potentially interbreeding.
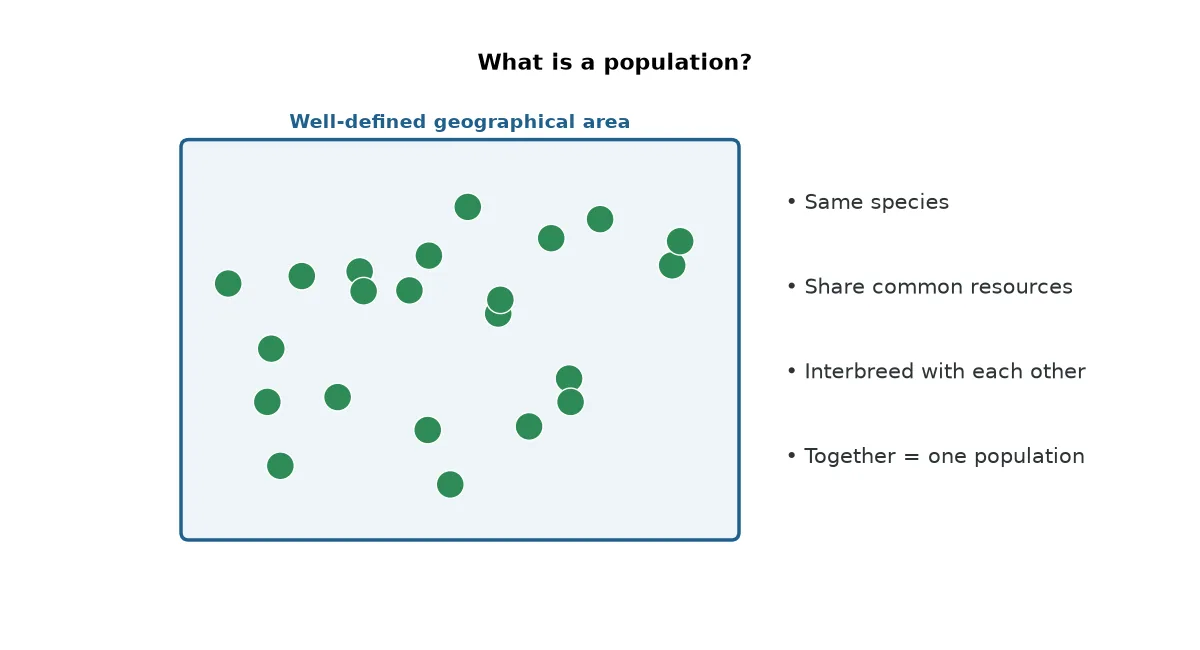
The organisms in the diagram live in a defined area and can interbreed to produce offspring, so together they form a population. Every population has attributes that a single individual does not have, which we discuss next.
Characteristics of a population
| Attribute | Meaning | Example |
|---|---|---|
| Population size | Total number of individuals | A city with 10 million people (illustrative) |
| Population density (N) | Individuals per unit area or volume, e.g. per km² or per m³ | People per km² in South Delhi vs East Delhi |
| Birth rate / death rate | Per capita births or deaths per unit time | 8 lotus plants born per 20 = 0.4 per year |
| Sex ratio | Proportion of females to males | 60% female, 40% male |
| Age distribution | Proportion of pre-reproductive, reproductive and post-reproductive individuals; shown as an age pyramid | Expanding, stable or declining pyramid |
Population size tells us how many individuals there are, but not how they are spread. Population density fills that gap by measuring individuals per unit area (km², not km). Density need not always be a head count: percent cover or biomass can be better, for example when one huge banyan tree and 200 Parthenium plants share a field.
Population growth is how population size changes over time, because a population is dynamic. Studying it tells us why a population is increasing, decreasing or stable. A rapidly growing population uses resources faster and increases competition. Competition often eliminates the weaker competitor locally, which can reduce biodiversity. Growing human populations also drive deforestation and higher emissions, which contribute to climate change.
4 factors that change population density
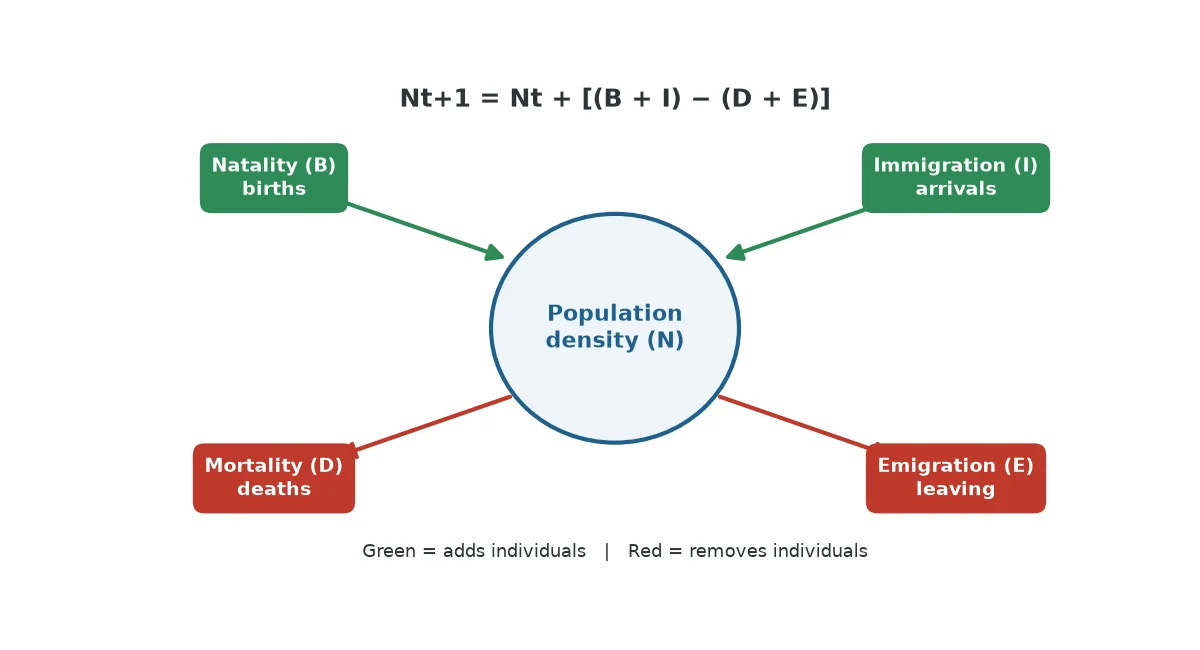
Population density changes through four basic processes. Two add individuals and two remove them.
| Process | Symbol | Effect on N |
|---|---|---|
| Natality: births in the population in a given period | B | Increases |
| Immigration: individuals of the same species arriving from elsewhere | I | Increases |
| Mortality: deaths in the population in a given period | D | Decreases |
| Emigration: individuals leaving the habitat | E | Decreases |
Population growth rate and per capita growth rate (r)
We need three terms to understand population growth:
- Birth rate and death rate (B, D)
- Population growth rate (dN/dt)
- Per capita population growth rate (r)
Let’s take a simple example of a rabbit population. In 2019 the total population (N) was 600 rabbits. There were 60 births per year (B) and 30 deaths per year (D). For simplicity, we assume no rabbits moved in or out (I = E = 0).
This 30 rabbits/year is the contribution of all 600 rabbits together. To find each rabbit’s share, we divide by N. That gives the per capita growth rate, r, also called the intrinsic rate of natural increase.
So each rabbit adds 0.05 rabbits per year on average, and the population would rise from 600 to about 630 in a year. Rearranging gives the growth equation. Here is the derivation step by step:
Derivation of dN/dt = rN
Multiply both sides by N:
N cancels on the right-hand side, so:
For the rabbits:
Exponential growth: the J-shaped population growth curve
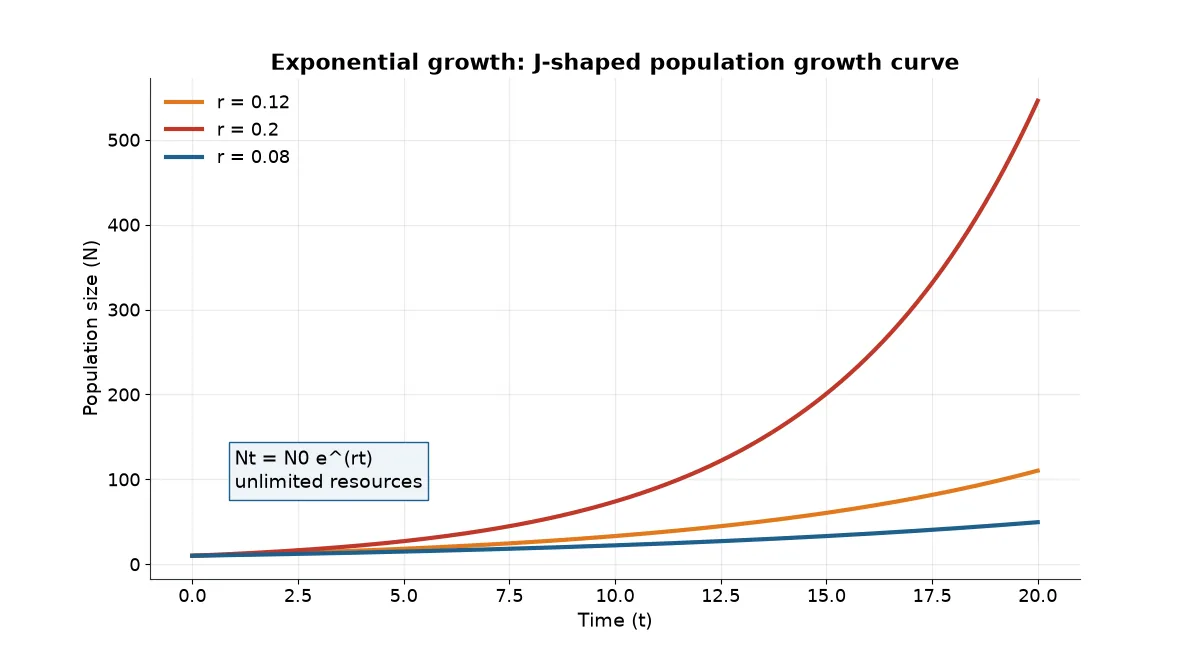
Exponential growth is possible only when resources (food and space) are unlimited, so there is no competition. Then every species can realise its full innate potential to grow. The differential equation is:
dN/dt gives the rate at one instant. To find the population size at any future time t (for example March 2020, starting from December 2019), we integrate dN/dt = rN. Here is the complete derivation:
Derivation of Nt = N0 ert
Step 1. Start from the exponential growth equation and separate the variables:
Step 2. We know that d(loge x)/dx = 1/x, so dx/x = d(loge x). Therefore:
Step 3. Integrate both sides, N from N0 to Nt and time from 0 to t:
Step 4. Evaluate the integrals:
Step 5. Take the antilog (exponential) of both sides:
where Nt is the population density after time t, N0 is the density at time zero, r is the intrinsic rate of natural increase and e is the base of natural logarithms (2.71828). Plotting N against t gives a J-shaped curve.
Sample r values
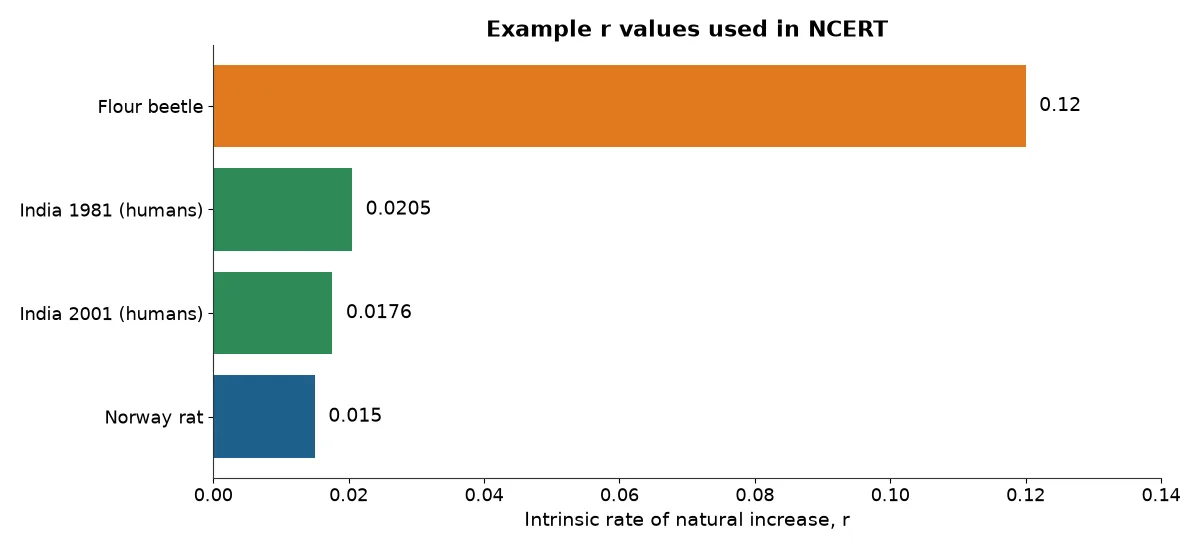
We can use the equation to predict Nt if we know N0 and r. NCERT gives these values of r:
| Population | r |
|---|---|
| Norway rat | 0.015 |
| Flour beetle | 0.12 |
| India, human population, 1981 | 0.0205 |
India’s r fell from 0.0205 in 1981 to about 0.0176 by 2001 (Census-based estimate), so the per capita growth rate decreased. The population still grew, but each individual contributed less to that growth than in 1981.
Logistic growth: the S-shaped population growth curve
Resources are limited in reality. Every habitat can support only a certain number of individuals. This limit is the carrying capacity (K). When we include K, the growth equation changes from dN/dt = rN to:
(K − N) tells us how many more individuals the habitat can take before it reaches the carrying capacity. (K − N)/K is the fraction of the carrying capacity not yet used. When N is small, this fraction is close to 1 and growth is nearly exponential. When N = K, the fraction becomes 0 and growth stops.
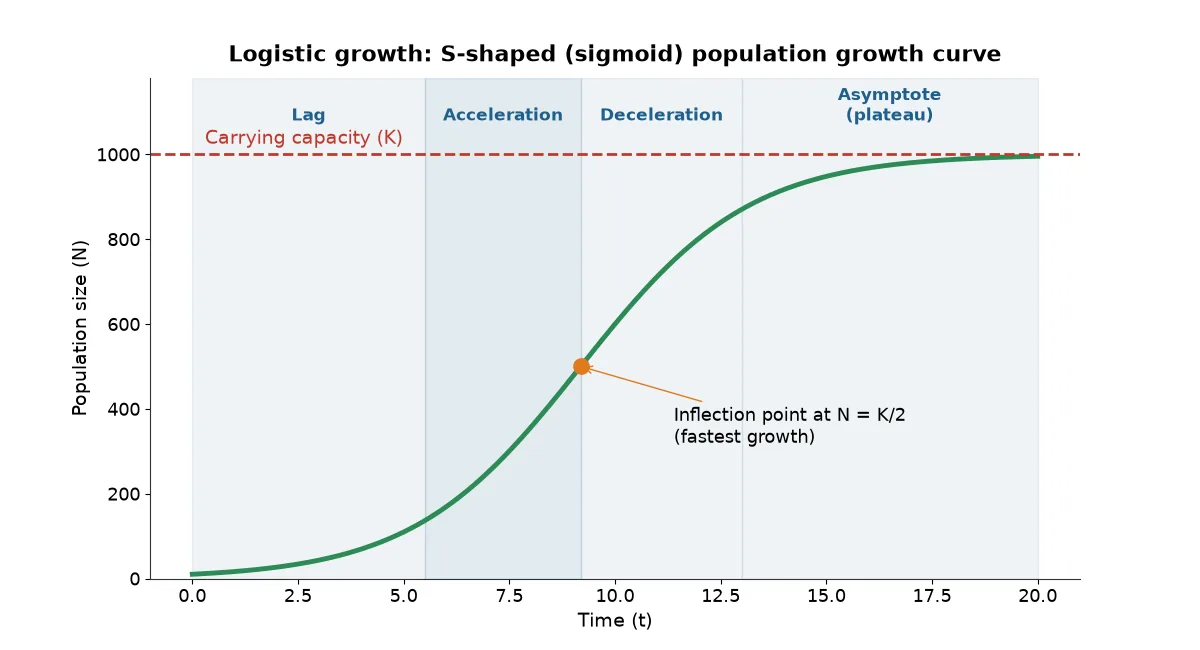
Plotting N against t gives a sigmoid (S-shaped) curve. This is called Verhulst–Pearl logistic growth. It has four phases:
| Phase | What happens |
|---|---|
| 1. Lag phase | Few individuals; slow growth while they adjust and start breeding. |
| 2. Acceleration (log/exponential) phase | Growth speeds up; dN/dt is highest at the inflection point, N = K/2. |
| 3. Deceleration phase | Environmental resistance (competition, predation, disease) grows; growth slows. |
| 4. Asymptote (plateau / equilibrium) | N stays near K; dN/dt is about zero because births + immigration = deaths + emigration. |
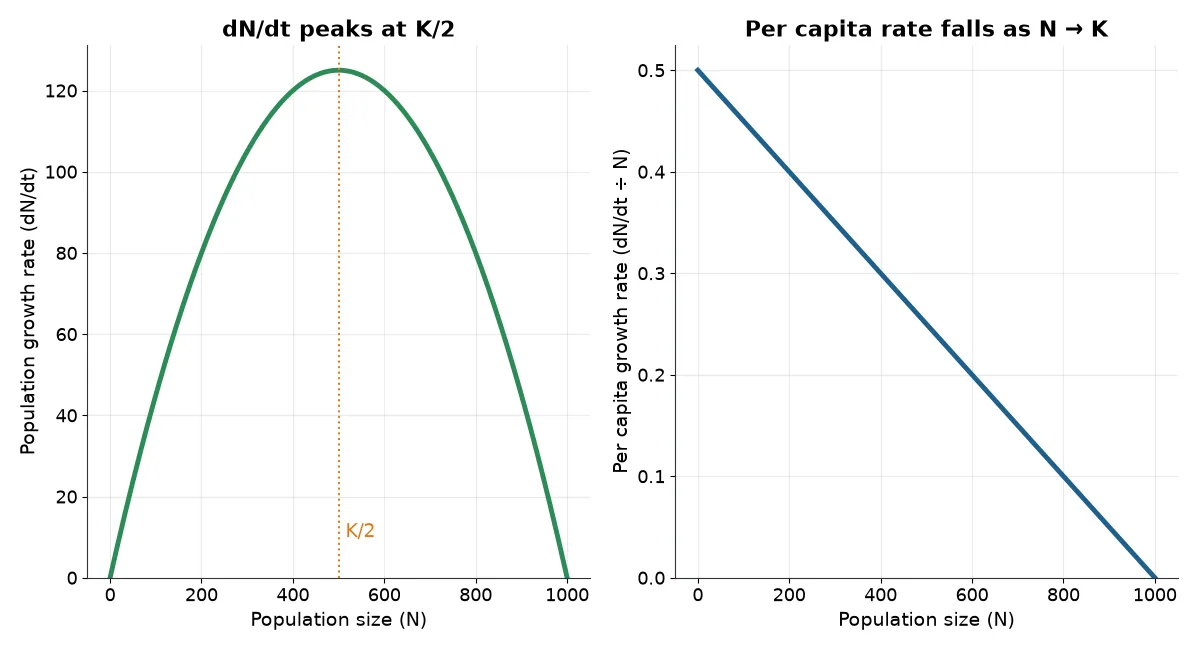
The logistic model is more realistic than the exponential model, because no population has unlimited resources.
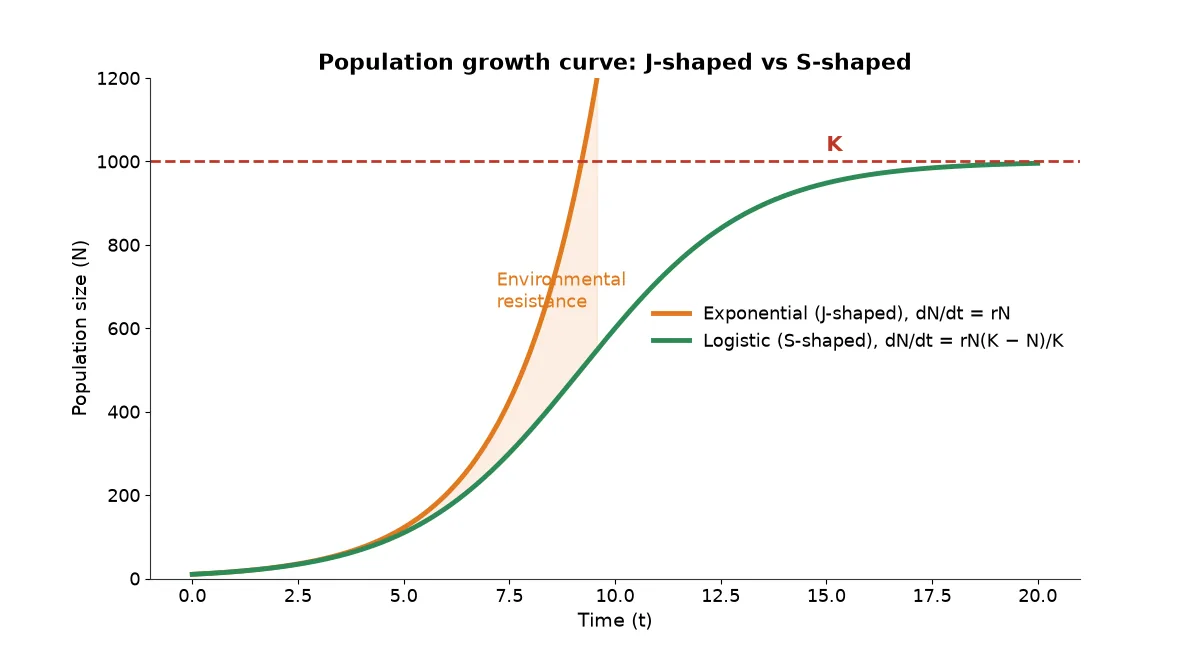
Exponential vs logistic population growth curve
| Feature | Exponential | Logistic |
|---|---|---|
| Shape | J-shaped | S-shaped (sigmoid) |
| Resources | Unlimited | Limited |
| Equation | dN/dt = rN | dN/dt = rN(K − N)/K |
| Carrying capacity | Not considered | Population levels off at K |
| Per capita rate | Constant (r) | Falls as N rises |
| Realism | Short bursts only (e.g. bacteria in fresh medium, algal blooms) | Most natural populations |
Life history variation: r- and K-selection
Populations evolve to maximise their reproductive fitness (Darwinian fitness, a high r) in the habitat they live in. Depending on the selection pressure, some organisms breed only once in their lifetime (Pacific salmon, bamboo), while others breed many times (most birds and mammals). Some produce many small offspring (oysters, pelagic fishes); others produce a few large offspring (birds, mammals).
| r-selected | K-selected |
|---|---|
| Unstable or unpredictable habitats | Stable habitats, population near K |
| Many small offspring, little parental care | Few large offspring, high parental care |
| Early maturity, short life | Late maturity, long life |
| Insects, weeds, bacteria | Elephants, whales, humans |
IB Biology relevance (C4.1 Populations and communities)
SL/HL IB topic C4.1 includes population growth curves. You should be able to explain exponential growth when resources are unlimited, and the sigmoid curve that results when limiting factors act. Label the exponential phase, the transitional phase and the plateau phase at carrying capacity. Be ready to test the curve with real data, for example duckweed or yeast cultures.
SL/HL Link the plateau to density-dependent factors such as competition, predation and disease. IB uses the term “transitional phase” where NEET texts say “deceleration phase”. Learn both sets of labels, but use the right one for each exam.
For more IB notes, see our IB Biology hub. NEET students can practise with our 40 NEET sample test papers.
Tap-to-reveal revision cards
Try to answer each card first, then tap it to check.
dN/dt = rN describes?
Exponential (J-shaped) growth with unlimited resources.
What makes logistic growth stop?
When N = K, (K − N)/K = 0, so dN/dt = 0.
r of flour beetle?
0.12 (Norway rat is 0.015).
India's r in 1981?
0.0205.
Two processes that add to N?
Natality (B) and immigration (I).
Where on the S-curve is dN/dt highest?
At the inflection point, N = K/2.
Another name for the logistic curve?
The Verhulst–Pearl logistic growth curve.
Which model is more realistic?
Logistic, because resources are always finite.
Common doubts about the population growth curve
What is a population growth curve?
A population growth curve is a graph of population size (N) against time (t). It shows how births, deaths, immigration and emigration change a population. With unlimited resources it is J-shaped (exponential); with limited resources it becomes S-shaped (logistic) and levels off at the carrying capacity, K.
What is the difference between exponential and logistic growth?
Exponential growth assumes unlimited food and space, so the population increases by a fixed proportion each time interval and forms a J-shaped curve (dN/dt = rN). Logistic growth includes limited resources: growth slows as N approaches the carrying capacity K, giving an S-shaped curve (dN/dt = rN(K − N)/K).
What does r mean in dN/dt = rN?
r is the intrinsic rate of natural increase, the per capita growth rate (births minus deaths per individual per unit time). A larger r means faster growth. NCERT examples: Norway rat 0.015, flour beetle 0.12, and India's human population 0.0205 in 1981. Note: r is a rate, not a number of individuals.
What is carrying capacity (K)?
Carrying capacity is the maximum population size that a habitat can support indefinitely with its available resources such as food, water, space and shelter. In the logistic model, when N equals K the term (K − N)/K becomes zero, so dN/dt is zero and the population stops growing and stays at a plateau.
Why is the logistic model considered more realistic?
No habitat has unlimited resources. As a population grows, competition for food, space and mates increases, and predation and disease rise. These forms of environmental resistance slow growth. The logistic model includes this through K, so it describes most natural populations better than the exponential model, which works only for short periods.
At what population size is the growth rate fastest in logistic growth?
In logistic growth, the population growth rate dN/dt is highest at N = K/2, the inflection point of the S-curve. Below K/2 there are too few breeders; above K/2 resistance increases. NEET trap: the per capita rate (dN/dt ÷ N) is not maximum at K/2; it is highest when N is very small.
Is the J-shaped curve the same as exponential growth?
Yes. The J-shaped curve is the graph of exponential growth, Nt = N0 e^(rt). It rises slowly at first and then very steeply because each new individual also reproduces. In nature, J-shaped growth often ends in a sudden crash, for example in algal blooms or insect outbreaks, when resources run out.
Do immigration and emigration affect population growth?
Yes. Population density changes through four processes: natality (B) and immigration (I) add individuals, while mortality (D) and emigration (E) remove them. Nt+1 = Nt + [(B + I) − (D + E)]. Natality and mortality are usually the main factors, but immigration can matter greatly for a newly colonised habitat.
What are r-selected and K-selected species?
r-selected species, such as many insects and weeds, produce many small offspring, mature early and live in unstable habitats, so they maximise r. K-selected species, such as elephants and humans, produce few large offspring with high parental care and stay near K. Most organisms lie between these two extremes.
Can the population growth rate be zero while births still happen?
Yes. Growth rate is zero whenever additions equal losses, that is, (B + I) = (D + E). Births and deaths still occur, but they balance. This is what happens at the plateau of the S-shaped curve when N = K. Students often wrongly assume zero growth means no births.
Further reading: NCERT Biology textbook (official) and Nature Education: How populations grow. Related on this site: ozone depletion in the stratosphere and all biology topics.