
Ecosystem NEET preparation starts with NCERT Class 12 Biology Chapter 12, and this guide explains it in simple words with labelled diagrams. Every Ecosystem NEET topic here — structure, productivity, decomposition, energy flow and ecological pyramids — follows the NCERT text, so you can revise it once and answer most Ecosystem NEET questions with confidence.
Key points (NCERT Class 12 Biology, Chapter 12)
- An ecosystem is a functional unit of nature where living organisms interact among themselves and with their physical environment.
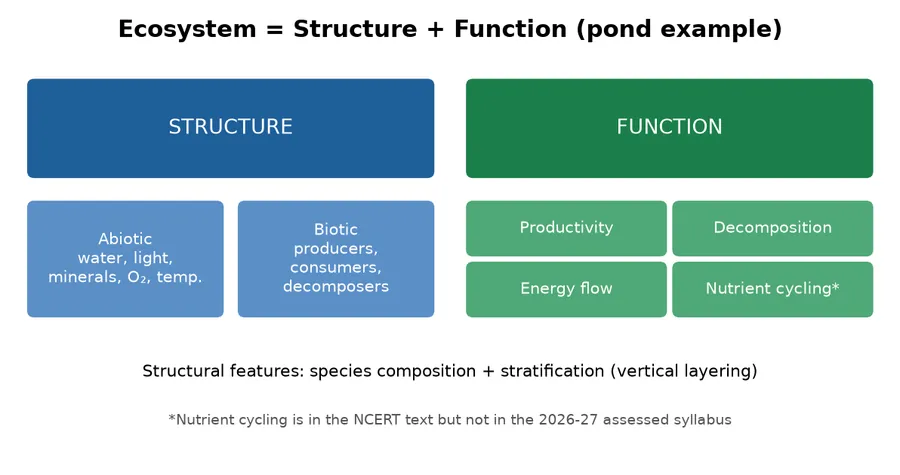
- Structure = abiotic + biotic components, species composition and stratification. Function = productivity, decomposition, energy flow (and nutrient cycling).
- Energy flow is one-way; only about 10% of energy passes from one trophic level to the next.
- The pyramid of energy is always upright; pyramids of number and biomass can be inverted.
What is an ecosystem?
Let’s understand the ecosystem with a simple example. Suppose there is a pond (an aquatic environment). It includes water, light, inorganic minerals, and temperature cycles. It also contains single-celled plants (phytoplankton), single-celled animals (zooplankton), small fish, plants growing at the pond’s edges, free-floating plants, and submerged plants.
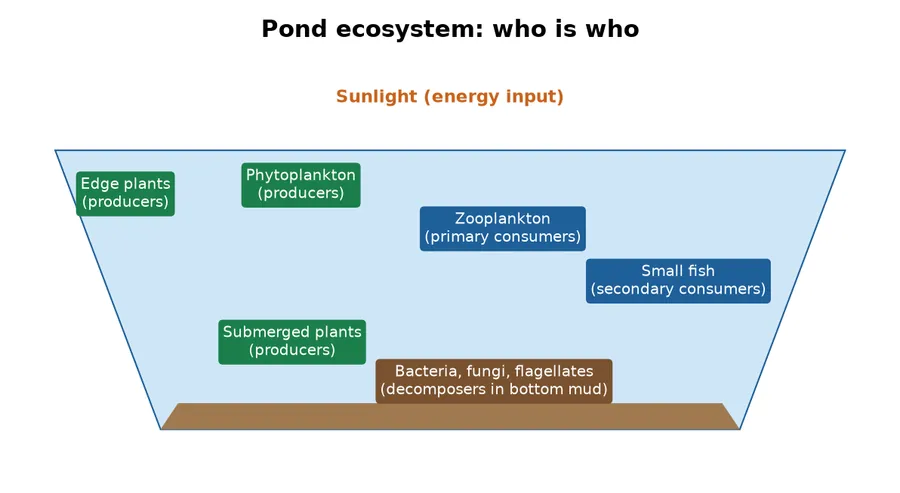
A pond ecosystem has two basic components: structural and functional. The former is further divided into:
- Abiotic: water, minerals, dissolved oxygen, temperature, and light
- Biotic: Producers (phytoplankton, submerged plants, free-floating plants, plants growing in edges)
- Consumers: zooplankton, fishes
- Decomposers: flagellates, bacteria, fungi
NCERT detail: the abiotic component is the water with all its dissolved inorganic and organic substances and the rich soil deposit at the bottom; solar input, the cycle of temperature, day-length and other climatic conditions regulate the rate of function of the whole pond. Producers include phytoplankton, some algae and the floating, submerged and marginal plants; consumers are zooplankton and the free-swimming and bottom-dwelling forms; decomposers (fungi, bacteria, flagellates) are especially abundant at the bottom. The pond converts inorganic into organic matter using sunlight, autotrophs are eaten by heterotrophs, and dead matter is decomposed and mineralised for reuse — over and over again.
Functional components of the ecosystem are involved in production (productivity), energy flow, and decomposition.
An ecosystem is a functional interaction involving biotic and abiotic components. In other words, an ecosystem is defined as a functional unit of nature, where living organisms interact among themselves and also with the surrounding physical environment (NCERT). The term ecosystem was given by A. G. Tansley (1935).
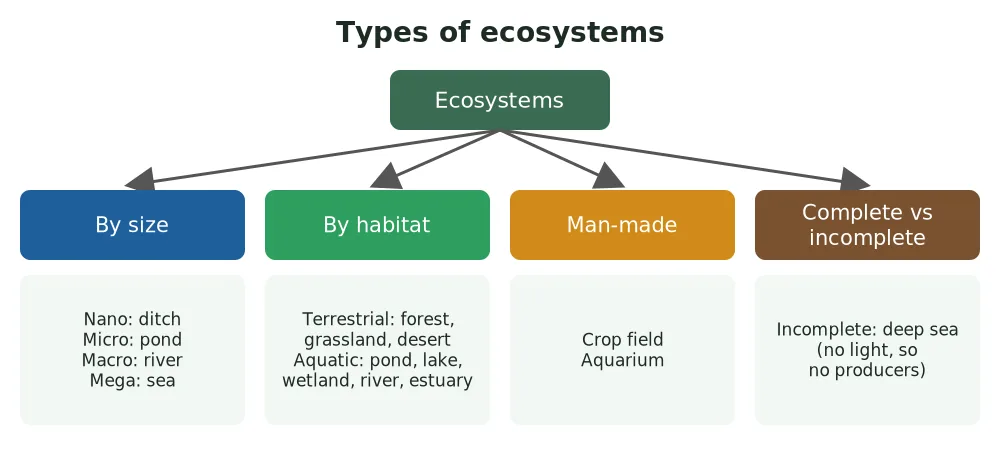
NCERT notes that ecosystems vary greatly in size, from a small pond to a large forest or a sea, and many ecologists regard the entire biosphere as a global ecosystem.
Types of ecosystems
- On the basis of size: small ditches (nano ecosystem), pond (micro ecosystem), river (macro ecosystem), and sea (mega ecosystem)
- On the basis of habitat: Biosphere (global ecosystem) – it comprises aquatic, terrestrial, and atmospheric environments. Example: Aquatic ecosystem (pond, river, estuaries, wetlands) and Terrestrial ecosystem (forest, desert, grassland, tundra (Iceland))
- Manmade ecosystem (agricultural field, aquarium)
- Complete and incomplete ecosystem: An ecosystem is complete if it has all its components. In an incomplete ecosystem, such as the deep sea, light is absent, so photosynthetic producers are absent and mainly consumers and decomposers are present (they depend on organic matter sinking from above; at hydrothermal vents, chemosynthetic bacteria act as producers).
Features of an ecosystem
- Self-sustaining
- Structural and functional components should be present
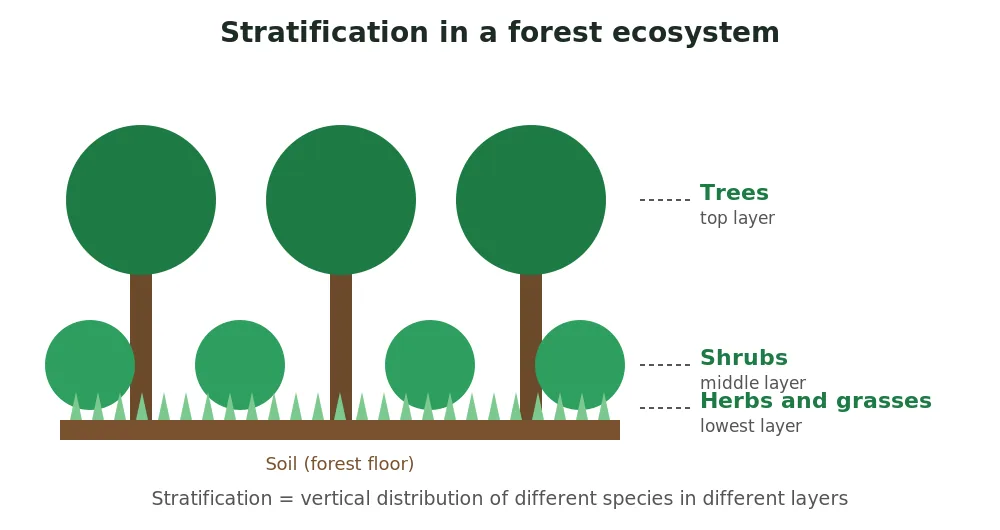
- Stratification: vertical distribution of species in different layers. For example, in a forest ecosystem, grasses (lowest layer) are followed by herbs and shrubs, followed by trees. Each layer constitutes different species of organisms.
- Standing crop: the mass of living material present in a trophic level at a particular time. It is for biotic components only (NCERT measures it as biomass or number per unit area; biomass is expressed as fresh or dry weight, and dry weight is more accurate because water content varies).
- Standing state: the amount of nutrients such as carbon, nitrogen, phosphorus and calcium present in the soil at any given time. It is for abiotic components only. (from the nutrient-cycling section, not in the 2026-27 assessed syllabus)
Productivity
Primary production: The amount of biomass or organic matter produced per unit area over a time period by plants during photosynthesis. Its unit is kcal/m² or g/m². The units show that primary production can be measured in terms of energy or biomass.
Primary productivity is the rate of primary production. Its unit is kcal m⁻² yr⁻¹ or g m⁻² yr⁻¹. Primary productivity helps compare two ecosystems. For instance, let’s compare a forest ecosystem and a desert ecosystem:
| Primary production (g/m²) | Forest | Desert |
|---|---|---|
| Jan – Apr | 10 | 15 |
| May – Aug | 25 | 11 |
| Sept – Dec | 15 | 7 |
| Total for the year (productivity) | 50 | 33 |
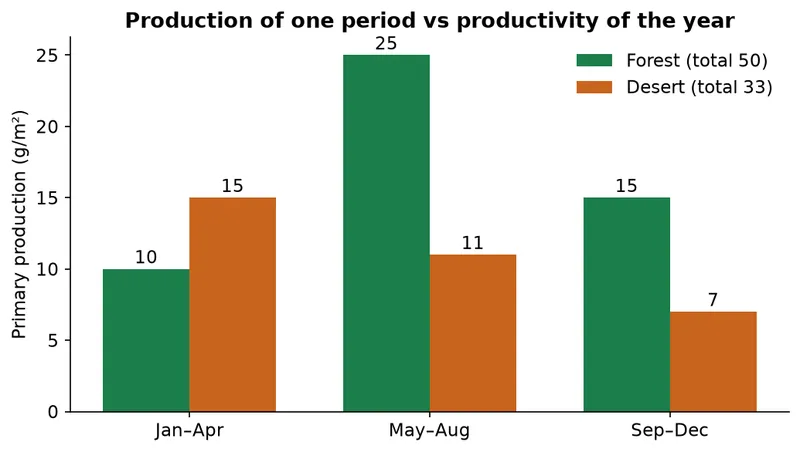
The values given in the table are primary production values. However, adding them all gives the total annual primary productivity. So, the total forest productivity is higher than desert productivity. However, primary production for Jan-Apr is higher in the desert than in the forest. In other words, when comparing two ecosystems, use primary productivity rather than primary production because the former gives the total value per year and not for a particular month.
Types of primary productivity
Before getting into the types of primary productivity, let’s discuss a simple example to understand the upcoming concept:
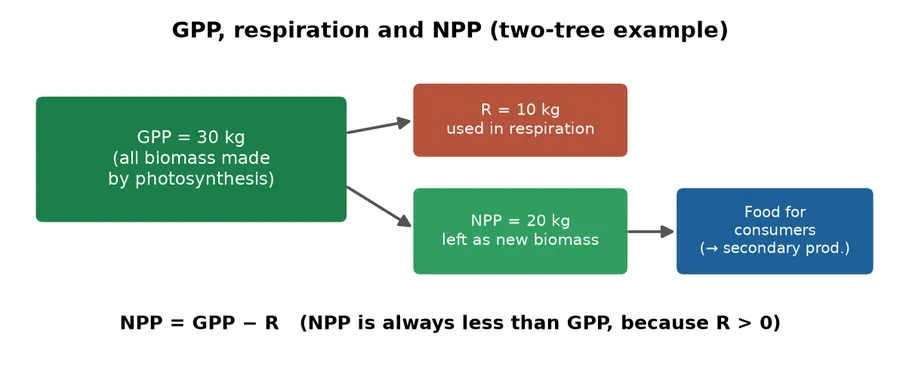
Suppose there are two trees in a given area, and their combined biomass is, say, 1000 kg. After a year, their total biomass becomes 1020 kg. So, the net increase in biomass is 20 kg. However, during the year, the trees actually produced 30 kg of new biomass. Out of this, 10 kg was used by the trees during respiration. Therefore, total mass produced = 30 kg and biomass remaining = 20 kg. This gives us two types of primary productivity:
- GPP (Gross Primary Productivity): the rate of production of organic matter during photosynthesis, i.e., the total amount of biomass produced by plants
- NPP (Net Primary Productivity): the biomass left after respiration losses (R); it is available to heterotrophs (herbivores and decomposers)
NPP = GPP – R
Conditions:
- Can NPP be zero – yes, if GPP = R
- Can NPP equal GPP – not possible (plants always respire, so R is never zero)
- Can NPP > GPP – not possible
Ecosystem NEET tip: examiners like to test whether you know that productivity is a rate (with “per year” in the unit) while production is an amount.
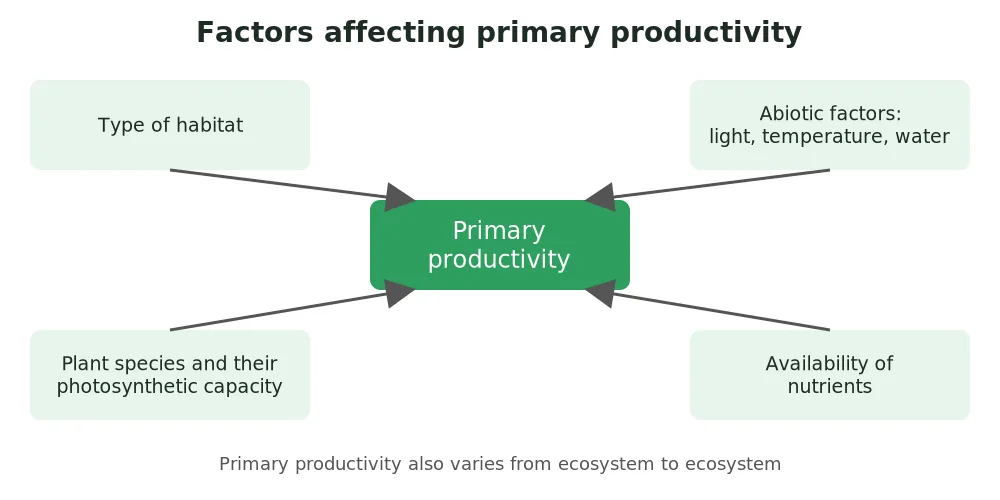
Factors controlling primary productivity
- Types of habitats
- Types of plant species (and their photosynthetic capacity)
- Abiotic factors (environmental factors and availability of nutrients)
The NPP produced is now available for consumers. So, the biomass taken by the consumer increases the consumer’s biomass; the rate of formation of new organic matter by consumers is called secondary productivity. For instance, if a deer consumes NPP and increases its weight by, say, 5 kg in a year, then this value is its net secondary production for that year.
Comparison of primary productivity
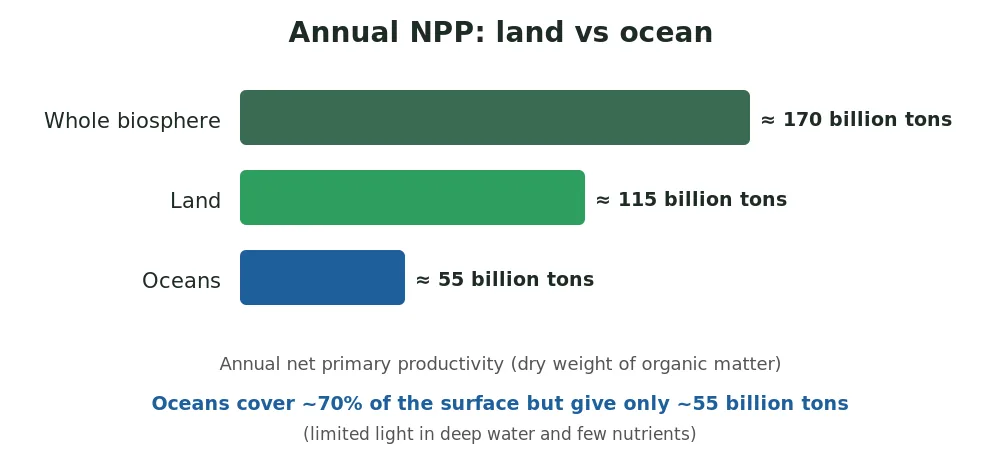
- Annual NPP of the whole biosphere ≈ 170 billion tons (dry weight) of organic matter. Oceans contribute only ≈ 55 billion tons despite covering about 70% of the surface, so Land (≈115 billion tons) > Water (55 billion tons)
- Why is the ocean low? NCERT asks you to discuss this; the main reasons are light that does not penetrate deep water and scarce nutrients in open-ocean surface water (light is a key limiting factor in aquatic ecosystems).
- Terrestrial: tropical forest > temperate forest > grassland > desert
- Water: coral reefs > estuarine > temperate ocean > tropical ocean
- Agricultural field: C4 plant (sugarcane – highest productivity)
Decomposition
It is the process of conversion of complex organic matter into inorganic matter such as carbon dioxide, water and nutrients (minerals). Decomposers (mainly bacteria and fungi) do this.
Detritus: means dead remains of plants and animals. Examples: leaves, bark, branches, flowers, excreta (faecal matter), dead insects, etc. Detritus is the raw material for decomposition.
Earthworms, also known as friends of farmers (they help break down complex organic matter and loosen the soil), eat detritus and are thus called detritivores.
Steps of decomposition
- Fragmentation: Suppose there are dead leaves on the ground. Earthworms eat those leaves and break them into small pieces. This process is called fragmentation. This increases the surface area of the dead leaves, making them easier for fungi and bacteria to attack.
- Leaching: During decomposition, water-soluble inorganic nutrients go down into the soil horizon; this process is called leaching. These leached minerals eventually precipitate as unavailable salts.
- Catabolism: The broken leaves after fragmentation are attacked by bacteria and fungi. They secrete enzymes onto the fragments, resulting in extracellular digestion that degrades detritus into simpler inorganic substances.
- Humification: leads to accumulation of humus. It is dark-coloured, amorphous, colloidal, highly resistant to microbial action (so it decomposes very slowly), and acts as a reservoir of nutrients.
- Mineralization: Humus is microbial resistant, but humus also slowly breaks down and slowly releases inorganic minerals into the soil. This process is called mineralization.
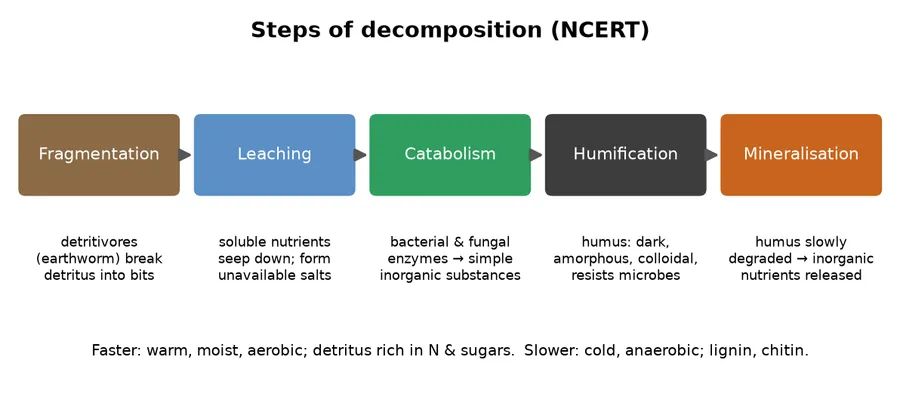
Note: The first three steps (1 to 3) begin on fresh detritus such as dead leaves; humification and mineralisation occur in the soil. NCERT adds that all the steps of decomposition operate simultaneously on the detritus.
Ecosystem NEET tip: learn the five steps in order (fragmentation, leaching, catabolism, humification, mineralisation); many Ecosystem NEET MCQs simply swap two of them.
Factors affecting decomposition
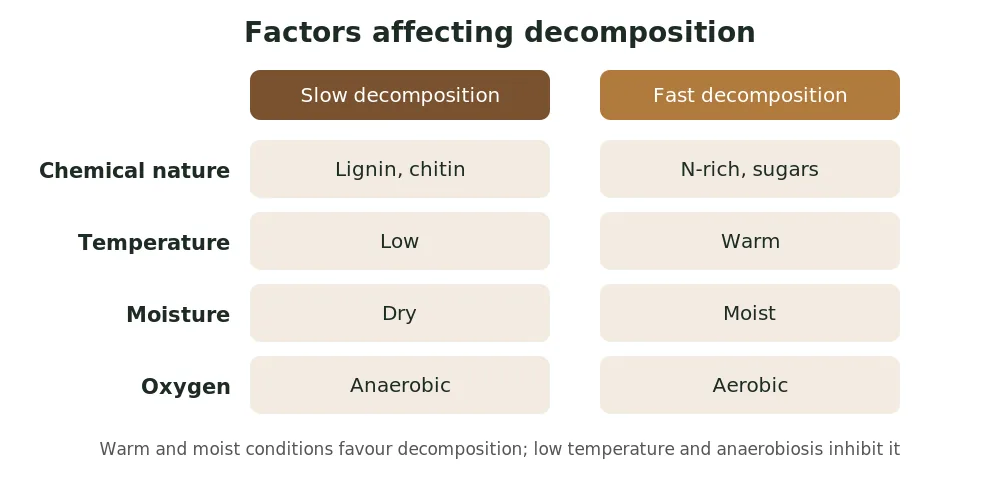
- Chemical nature of detritus: if the detritus contains lignin (wood), chitin (insects), it leads to slow decomposition. However, if the detritus is rich in nitrogen and water-soluble substances like sugars, decomposition speeds up.
- Temperature: At low temperatures, decomposition slows down (low temperature inhibits decomposition, so organic matter builds up). Temperature and soil moisture are the most important climatic factors, as they control the activity of soil microbes.
- Oxygen: Decomposition is largely an oxygen-requiring process; under anaerobic conditions, it slows down.
- Humidity (soil moisture): More moisture speeds up the decomposition process. A warm and moist environment favours decomposition.
Energy flow
Except for the deep-sea hydrothermal ecosystem, the sun is the only source of energy for all ecosystems on Earth.
Why the sun is the energy source for almost everything
Every ecosystem needs a primary producer – an organism that can make its own food from an energy source. For almost the entire planet, that energy source is sunlight.
The process is photosynthesis:
6CO₂ + 12H₂O + sunlight → C₆H₁₂O₆ (glucose, food) + 6O₂ + 6H₂O
Plants, algae, and cyanobacteria do this. They capture solar energy and store it as chemical energy (GPP). Then:
Sun → Plants (NPP) → Herbivore → Carnivore → Decomposer
Even when you eat chicken that ate corn, or burn petrol from ancient plants, the ultimate source is still the sun. Without the sun, photosynthesis stops, plants die, and the whole food chain collapses.
This is true for a forest, a grassland, a desert, a city park, and even the upper layer of the ocean where phytoplankton live. All sun-dependent.
Hydrothermal vents are fissures on the seafloor at mid-ocean ridges where cold seawater percolates down, is heated by underlying magma, reacts with basaltic crust to become enriched with H₂S and other chemicals, and then vents back into the ocean as mineral-rich hot fluid that supports chemosynthetic ecosystems.
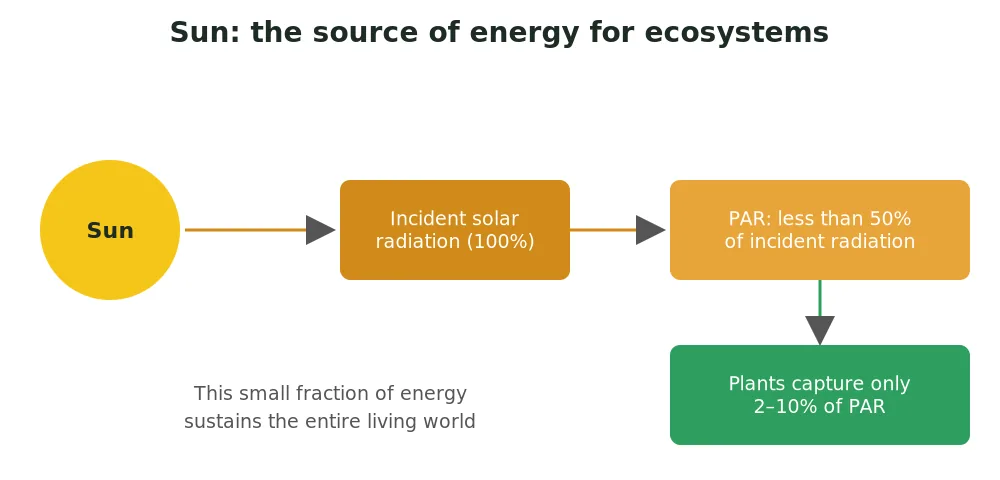
Of the incident solar radiation, less than 50% is photosynthetically active radiation (PAR; the 400–700 nm band), though it occupies only a very small fraction of the total wavelength range. Of PAR, plants capture only 2 to 10%, and this small amount sustains the entire living world.
PAR = Photosynthetically Active Radiation
Energy flow follows the laws of thermodynamics.
- First law: Energy is neither created nor destroyed, only transformed — light energy is converted into chemical energy (and finally heat).
- Second law: Every energy transfer loses some energy as heat and randomness (disorder) increases, so ecosystems need a constant input of energy to synthesise molecules and stay organised.
Ecosystem NEET tip: remember the two NCERT numbers together: PAR is less than 50% of incident radiation, and plants capture only 2–10% of PAR.
Trophic levels, food chain and food web
In the Ecosystem chapter, a trophic level is simply an organism’s position in the food chain. The word trophic comes from the Greek trophe, meaning nourishment.
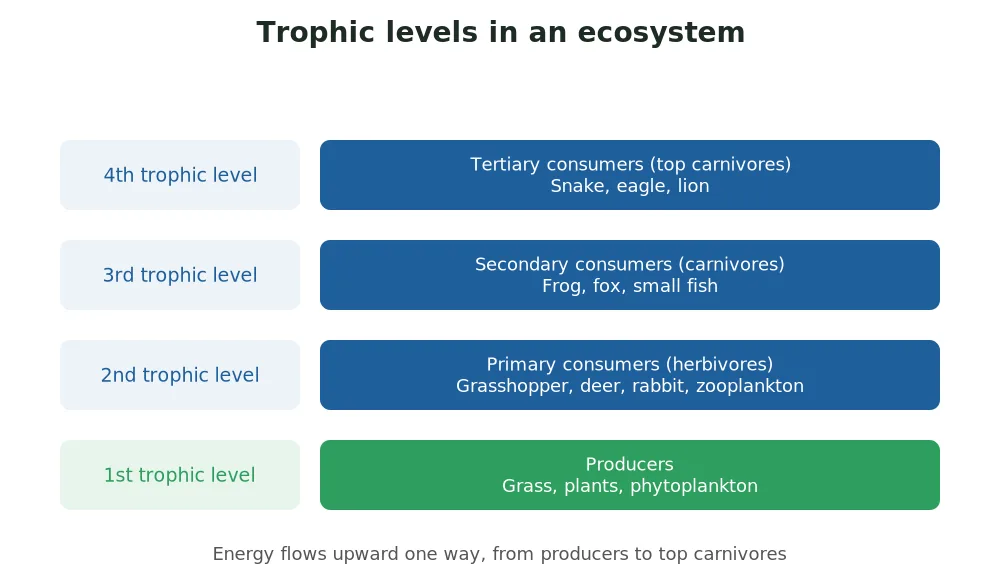
Trophic level 1: Producers
Plants, algae, phytoplankton, and, in hydrothermal vents, chemosynthetic bacteria. They make food from solar or chemical energy. They have the NPP we discussed. All energy enters from here. NCERT: on land the major producers are herbaceous and woody plants; in water, phytoplankton, algae and higher plants. Photosynthetic bacteria are also autotrophs.
Trophic level 2: Primary consumers – herbivores
Deer, rabbit, grasshopper, zooplankton. They eat Level 1 directly. They get NPP. NCERT examples: insects, birds and mammals on land and molluscs in water. Herbivores are also called secondary producers (NCERT Exercise Q4), because they produce new organic matter (secondary productivity).
Trophic level 3: Secondary consumers – carnivores
Frog, small fish, fox. They eat herbivores. NCERT calls them more correctly primary carnivores (though secondary consumers); animals that eat primary carnivores are secondary carnivores.
Trophic level 4: Tertiary consumers – top carnivores
Eagle, hawk, lion, shark. They eat secondary consumers.
| Trophic level | Role | Examples |
|---|---|---|
| I | Primary producer | Plants, phytoplankton |
| II | Secondary producer / herbivore / primary consumer | Grasshoppers, molluscs, zooplankton, cow |
| III | Primary carnivore / secondary consumer | Birds, fish, wolf |
| IV | Tertiary consumer / secondary carnivore / top consumer | Man, lion |
Note: one organism can occupy more than one trophic level at the same time (NCERT: a sparrow is a primary consumer when it eats seeds, fruits and peas, and a secondary consumer when it eats insects and worms). A trophic level is a functional level, not a species as such.
Food chain: organisms of different trophic levels linked by who-eats-whom (interlinked trophic levels).
Food web: interconnected food chains.
Types of food chain
- Grazing food chain (GFC): starts with a primary producer
- Grassland: grass, grasshopper, bird
- Aquatic: phytoplankton, zooplankton, and small fish
- Forest: tree, birds
- NCERT example: Grass (producer) → Goat (primary consumer) → Man (secondary consumer)
- Detritus food chain (DFC): begins with dead organic matter (detritus). It is made of decomposers — heterotrophic organisms, mainly fungi and bacteria (saprotrophs) — along with detritivores such as earthworms. Decomposers secrete digestive enzymes that break down dead and waste materials into simple inorganic materials, which they then absorb. The death of any organism is the beginning of the detritus food chain/web.
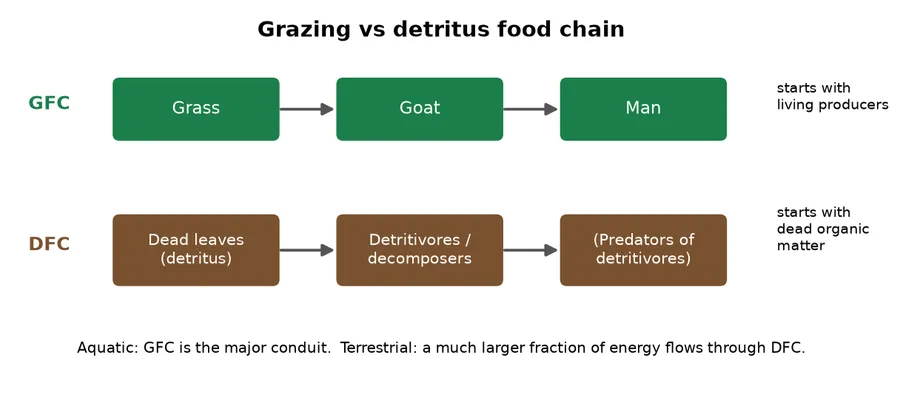
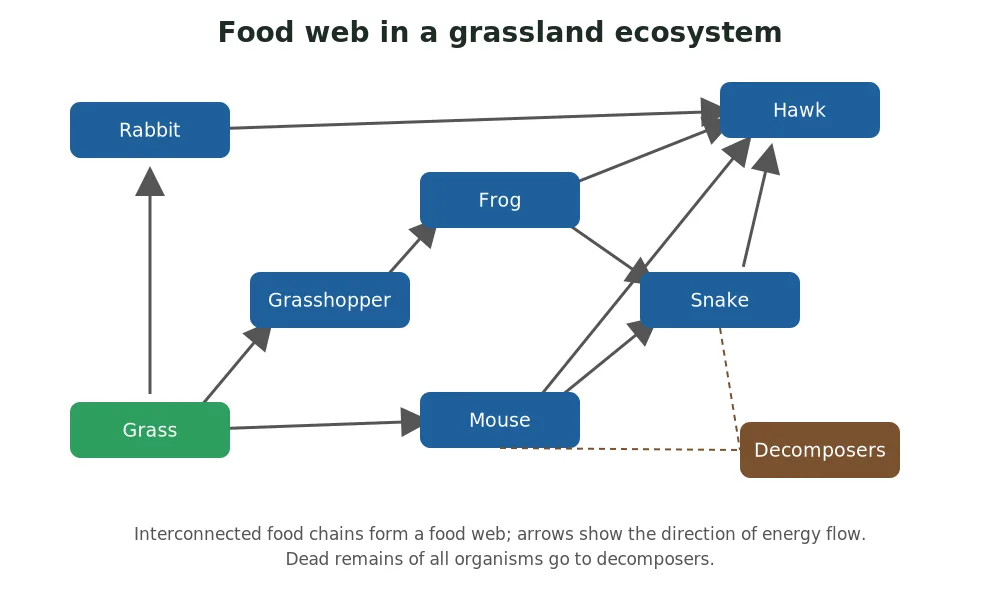
Note: GFC and DFC are present in all ecosystems and are connected. In aquatic ecosystems, GFC is the major conduit for energy flow. In terrestrial ecosystems, a much larger fraction of energy flows through the DFC than through the GFC, because most land-plant biomass (wood, leaves, litter) is not eaten by grazers and reaches the soil as detritus. The two chains are linked: some DFC organisms are prey for GFC animals, and omnivores such as cockroaches and crows feed in both. These natural interconnections make a food web.
Ecological pyramids
It graphically represents different trophic levels in terms of energy, biomass, and numbers.
- The base of the pyramid is always occupied by producers (first trophic level); the apex by top consumers.
- All members of one trophic level should be counted (all organisms at a level must be included).
- Standing crop: total biomass/numbers living in that trophic level at a particular time.
- The apex represents the tertiary or top-level consumer.
Examples of ecological pyramids (energy, number, biomass)
| Pyramid | Grassland | Forest | Aquatic (sea) |
|---|---|---|---|
| Energy | Upright | Upright | Upright |
| Number | Upright | Inverted | Upright |
| Biomass | Upright | Upright | Inverted |
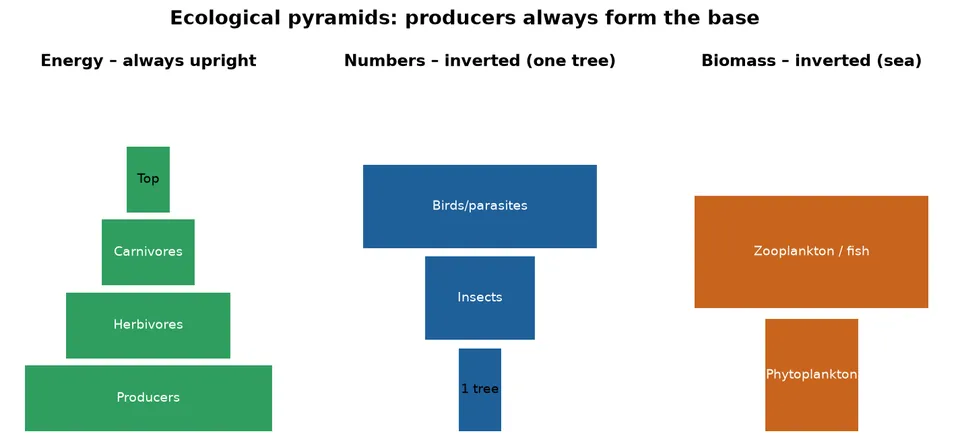
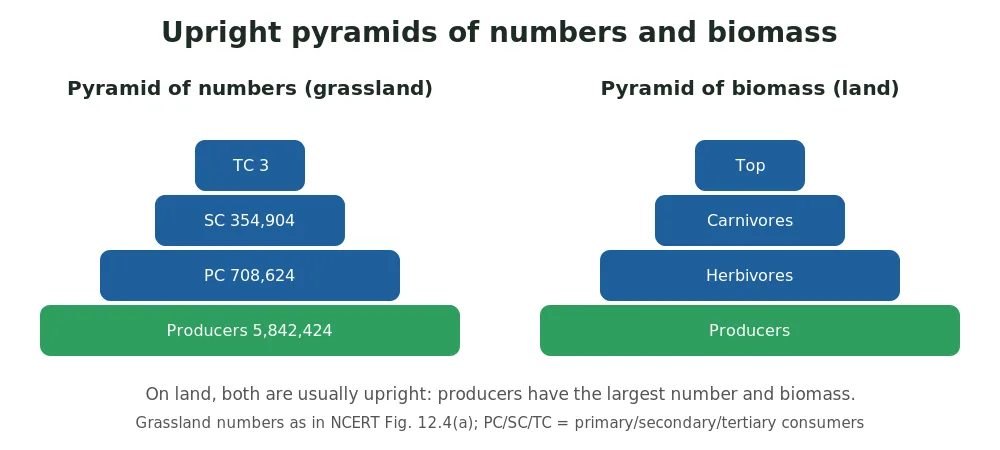
NCERT Figure 12.4(a): in a grassland, nearly 6 million plants support only three top carnivores. In most ecosystems all three pyramids are upright. Each bar of the energy pyramid shows the energy present at that trophic level in a given time or annually per unit area.
Why is the biomass pyramid inverted in the sea? Phytoplankton are tiny and reproduce very fast, so at any moment their standing crop is small, even though they support a larger standing crop of zooplankton; NCERT puts it as the biomass of fishes far exceeding that of phytoplankton. The pyramid of energy can never be inverted, because energy is lost as heat at every step.
Ecosystem NEET tip: energy pyramid = always upright; number pyramid of a big tree = inverted; biomass pyramid in the sea = inverted. These three pairs appear in Ecosystem NEET papers again and again.
Drawbacks (limitations) of ecological pyramids
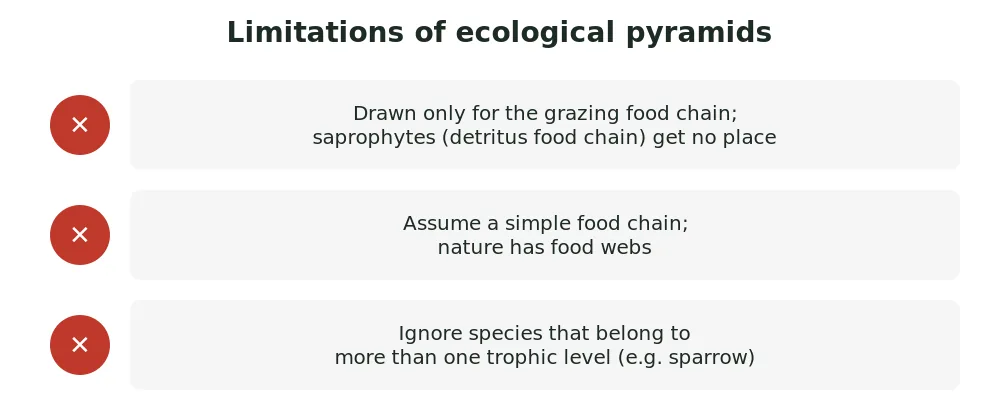
- It is drawn for GFC and not for DFC — saprophytes are given no place, even though they play a vital role
- It is drawn for a simple food chain, but nature also possesses food webs
- In nature, one organism can occupy more than one trophic level, which pyramids do not take into account
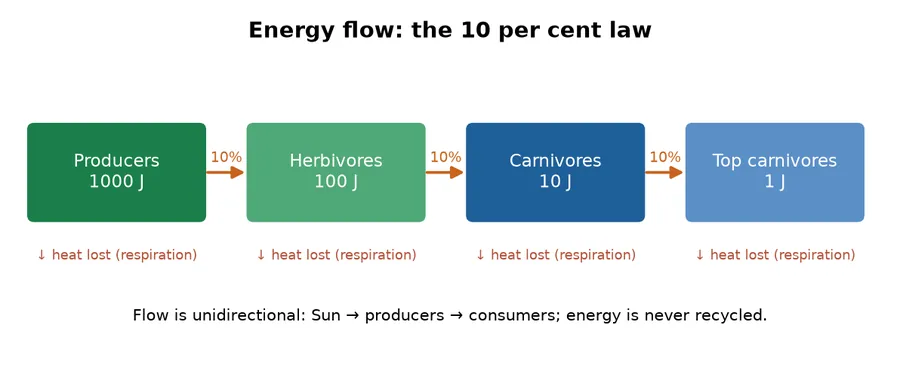
Energy flow in a food chain: the 10 per cent law
Only about 10% of the energy is transferred to each trophic level from the lower trophic level (the 10 per cent law; usually credited to Lindeman). Plants capture only 2–10% of PAR, and NCERT Figure 12.4(d) shows producers converting only about 1% of the sunlight available to them into NPP. The 10 per cent law restricts the number of trophic levels in the grazing food chain.
Sunlight (~1% into NPP) → Plants (1000 J) → Herbivores (100 J) → Carnivores (10 J) → Top carnivores (1 J)
Note: Nature does not support very long food chains — after 4–5 levels too little energy is left.
Ecosystem NEET tip: for numerical Ecosystem NEET questions, divide by 10 at each step (1000 J → 100 J → 10 J → 1 J).
Ecosystem NEET checklist (NCERT 2026-27)
Use this Ecosystem NEET checklist to tick off each NCERT section before your revision test.
| NCERT section | Covered here | Syllabus status |
|---|---|---|
| 12.1 Ecosystem – structure and function | Yes | Assessed |
| 12.2 Productivity (GPP, NPP, secondary) | Yes | Assessed |
| 12.3 Decomposition | Yes | Assessed |
| 12.4 Energy flow, food chains, food web | Yes | Assessed |
| 12.5 Ecological pyramids | Yes | Assessed |
| Succession, nutrient cycling, ecosystem services | Only a mention (standing state) | Not in 2026-27 assessed syllabus |
Official sources for Ecosystem NEET revision
- NCERT Class 12 Biology textbook – Chapter 12 Ecosystem
- NTA NEET (UG) official website for the exam notice and syllabus
- Britannica: Ecosystem for further reading
- UN Environment Programme: Ecosystems and biodiversity
Ecosystem NEET: Common doubts
These Ecosystem NEET doubts come from real student questions and the NCERT exercises.
What is the difference between an ecosystem and a biome?
A biome is a large region with a typical climate and vegetation, such as a tropical rainforest, desert or tundra. An ecosystem is any functional unit where organisms interact with each other and their physical environment; it can be as small as a pond or as big as the biosphere. One biome contains many ecosystems.
What is the difference between a community and an ecosystem?
A community is only the living (biotic) part: all populations in an area. An ecosystem is the community plus its abiotic environment (water, light, soil, minerals, temperature).
How does energy move from a food chain into an energy pyramid?
Measure the energy at each link of the food chain and stack it as bars, producers at the bottom. Because only about 10% passes to the next level (e.g., 1000 J → 100 J → 10 J → 1 J), each bar is smaller than the one below, so the pyramid of energy is always upright.
Why can’t energy be recycled in an ecosystem when nutrients can?
At every transfer part of the energy is lost as heat (second law of thermodynamics), and heat cannot be used by producers again. Nutrients, in contrast, are returned to the soil by decomposers and reused. So energy flow is unidirectional, while matter cycles.
What happens to an ecosystem if all the trees are removed?
Producers are the base of the grazing food chain, so primary productivity collapses, herbivores and carnivores lose food, litter for the detritus food chain disappears, soil loses humus, and less CO₂ is fixed by photosynthesis. The whole ecosystem would be reorganised or lost.
Why do freshwater ecosystems hold less life than oceans?
Mainly because they are tiny in area: freshwater covers under 2% of Earth’s surface while oceans cover about 70%. Per unit area, though, the open ocean is actually low in productivity; total ocean NPP is only about 55 of the 170 billion tons produced each year.
Is climate change part of an ecosystem?
Climate (temperature, rainfall, light) is part of the abiotic component of every ecosystem. A change in climate changes productivity, decomposition rate and which species can live there, so climate change acts on ecosystems.
Can an ecosystem become unhealthy?
Yes. Pollution, disease, removal of producers or introduction of invasive species can lower productivity, block decomposition or break food chains. Ecosystems with higher biodiversity usually resist such disturbances better and recover faster (resilience).
Why is the pyramid of biomass inverted in the sea?
Phytoplankton have a very small standing crop at any time but reproduce very quickly, so their small biomass supports a larger biomass of zooplankton and fish.
Why is the pyramid of energy never inverted?
Energy decreases at every higher trophic level because some is always lost as heat during respiration, so a higher level can never have more energy than the level below.
What is the difference between litter and detritus?
Litter is the dead plant material (leaves, twigs, bark) lying on the ground. Detritus is broader: all dead plant remains and dead animal remains, including faecal matter. It is the raw material for decomposition. NCERT asks this in Exercise 6(e).
Can NPP be greater than GPP?
No. NPP = GPP − R, and plants always respire, so NPP is always less than GPP; it can be zero only if all of the GPP is used in respiration.
Ecosystem NEET Practice Questions
Try these short Ecosystem NEET practice questions before moving to the full MCQ set.
Q1. Which pyramid is always upright?
- (a) Number
- (b) Biomass
- (c) Energy
- (d) All of these
Show Answer
Answer: (c) Energy — energy is lost as heat at each level.
Q2. A forest has GPP = 5000 kcal m⁻² yr⁻¹ and respiration = 2000 kcal m⁻² yr⁻¹. Find NPP.
Answer: NPP = GPP − R = 3000 kcal m⁻² yr⁻¹.
Q3. Which step of decomposition makes nutrients unavailable as salts deep in the soil?
- (a) Fragmentation
- (b) Leaching
- (c) Catabolism
- (d) Humification
Show Answer
Answer: (b) Leaching.
Q4. Through which food chain does most energy flow in a terrestrial ecosystem?
Answer: The detritus food chain (DFC).
Q5. What percentage of PAR is captured by plants?
- (a) 50%
- (b) 2–10%
- (c) 20–30%
- (d) 1%
Show Answer
Answer: (b) 2–10%.
Q6. In an ecosystem dominated by trees, the pyramid of numbers is of which type? (NCERT Ex. 1b)
Answer: Inverted.
Q7. Secondary producers are: (NCERT Ex. 4)
- (a) Herbivores
- (b) Producers
- (c) Carnivores
- (d) None of the above
Show Answer
Answer: (a) Herbivores.
Q8. Give one example each of an inverted pyramid of number and of biomass.
Answer: Number: a single tree with insects feeding on it. Biomass: phytoplankton–zooplankton in the sea.
Ready for more? Try 25 MCQs, 10 assertion–reason and 6 match-the-following questions in Ecosystem NEET MCQs with answers, the companion Ecosystem NEET practice post.